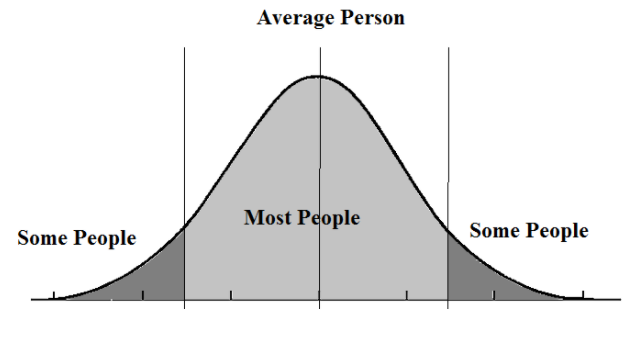
Have questions regarding how to interpret your child’s standardized testing? Interpretation varies depending on what test is used and the scale that the publisher uses. In a nutshell, all standardized scores show your child’s relative position under the normal curve. His or her performance (or number correct) on each section is compared to the “norm group” (usually a national sample of students your child’s age or grade) and then assigned a standard score that shows where they fall. The average (mean) for standardized scores vary but all should be accompanied by a “percentile” score. That percentile reveals what percentage of the norm group was equal to or less than your child’s performance. So, if your son earned a score at the 67th percentile, that would mean that 67% of students his age (or grade, depending on what type of norm group was used) scored equal to or below your child. It is NOT that he got 67% of the items correct.
Another concept that is important to keep in mind when interpreting standardized scores on a normal curve is that there is a big hump in the middle of the curve because most people fall there–in the Average range. In fact, 50% of the population falls in the Average range which leaves 25% of the population being Above Average and 25% being Below Average. Because the Average range has so many people in it, it has a large percentile range. That is, scores that fall between the 25th percentile and 75th percentile are in the Average range.
So take a look at your child’s Stanford scores and other standardized testing to see if you have any questions. If you are interested in individualized testing by Dr. Bell, you can learn more at our testing page.

